Recorded at this date.
Erdős problems in the AI era
See which Erdős problems have been resolved and which solutions have been checked in Lean.
Dates track database updates. AI release dates do not tell us which model, if any, helped solve a problem.
What do “resolved” and “Lean” mean?
Resolved includes problems that have been proved, disproved, or otherwise solved. The remaining statuses are grouped as open or unresolved.
Lean is software for checking mathematical proofs. Writing a problem’s statement in Lean is different from checking a solution. A Lean solution may be listed before the database’s resolved status is updated.
Proved, disproved, or otherwise solved.
Across all problem statuses.
Explore earlier snapshots
Choose a date or press Play to see how the database changed. Dots mark AI model releases.
Model releases
Loading historical snapshots…
Snapshot
How the problems break down
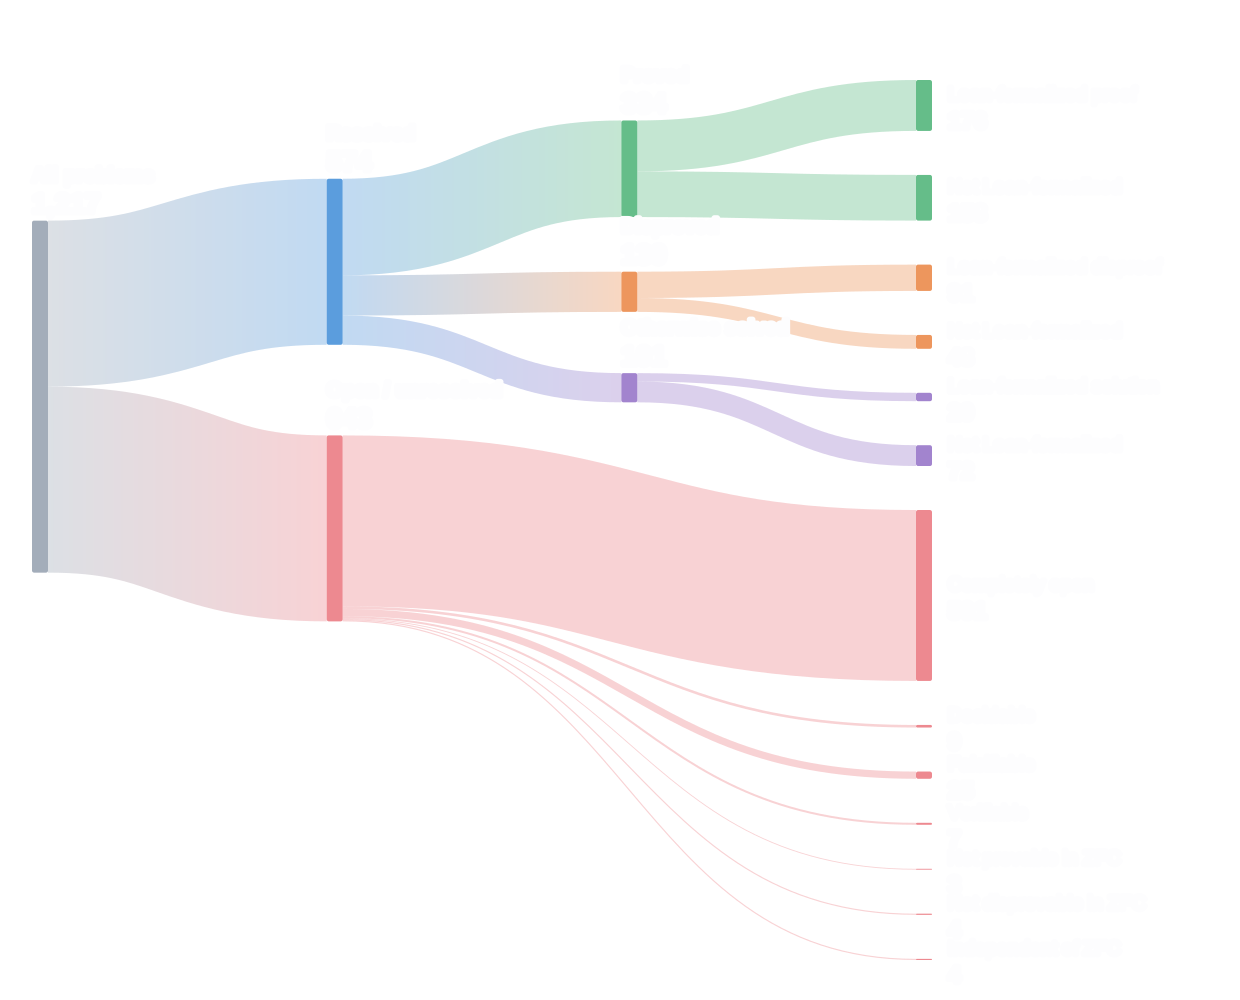
Read from left to right: all problems, their status, then whether a solution is recorded in Lean.
Scroll sideways to explore the diagram, or read the data table
Problem status
Snapshot: October 17, 2026“Problems”: % of all problems. Lean columns: % within each status. A dash means no data or an empty status.
| Status | Problems | Lean-formalized | Not Lean-formalized |
|---|---|---|---|
| Proved | 336 (27.5%) | 183 (54.5%) | 153 (45.5%) |
| Disproved | 139 (11.4%) | 97 (69.8%) | 42 (30.2%) |
| Otherwise solved | 101 (8.3%) | 33 (32.7%) | 68 (67.3%) |
| Completely open | 593 (48.6%) | — | — |
| Decidable | 8 (0.7%) | — | — |
| Falsifiable | 25 (2.0%) | — | — |
| Verifiable | 7 (0.6%) | — | — |
| Not provable in ZFC | 3 (0.2%) | — | — |
| Not disprovable in ZFC | 6 (0.5%) | — | — |
| Independent of ZFC | 3 (0.2%) | — | — |
| All problems | 1,221 (100.0%) | — | — |
More about these problems: prizes, Lean statements, and integer sequences
These groups overlap. OEIS is the Online Encyclopedia of Integer Sequences.
Monetary prize
107
problems carry a monetary prize
Statements formalized in Lean
872
problems have statements formalized in Lean in the Formal Conjectures Repository
Solutions formalized in Lean
318
313 resolved; 5 still unresolved
A Lean solution may be recorded before a human reviews it and updates the status
Linked to OEIS
358
problems linked to 474 integer sequences in OEIS, through 558 links
107 sequences added since this database began (A387000 onwards)
Possible OEIS links
310
problems with potential OEIS links not yet listed here
235 currently have no OEIS links
Sequence generation in progress
1
with a related sequence being generated
Related sequences being submitted to OEIS
0
Literature reviews requested
0
Ambiguous statements
11
problems have ambiguous statements